If your home network internet access suffers from spurious and unpredictable outages, this post will show you how to monitor your home network and see what happened and when. It is based on a patchwork of different opensource packages and languages, like Python, Docker, Telegraf, Grafana and InfluxDB.
Preface
I live in an old house and the internet connection is sometimes unreliable. When calling my operator to complain, the staff always ask for the number and date of the interruptions and I always have a hard time to give precise answers.
I order to have a better understanding of what happens on my internet access, I looked on the web for monitoring solutions running on Raspberry Pi.
First tries
My first choice was to install Smokeping. There is an excellent article on how to install and use it on the following link:
http://blog.kugelfish.com/2013/05/raspberry-pi-internet-access-monitor.html
This tool will provide excellent graphics on round trip time and lost packets.
Unfortunately, the graphics do not allow the most important information regarding my problem which is:
How many internet access failures occurred and when?
The graphic bellow illustrates that behavior. Four internet access failures occurred during the 30 hours' time represented here. Where are they?
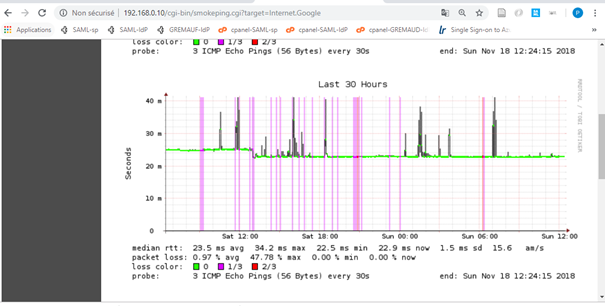
Interesting is the fact that Smokeping is able to clearly show the loss of 1 or 2 packets (violet and red vertical lines) but not the total loss of all packets (in that case 3) which, by the way, was exactly what I was looking for.
I also tried MRTG, a powerful tool, a little bit more difficult to get to work than Smokeping (made by the same author "Tobi Oetiker")

Same results that with Smokeping. Impossible to retrieve the actual internet access failures.
So what is the problem with these tools?
The problem is that they make averages of the real measurements when they store them for long term. This way, small interruptions (1 to 3 minutes) will be very hard to see in a 30 hours graphic and totally invisible in a one week graphic.
A better solution
After some researches, I came across an excellent article called "Monitoring your home network with InfluxDB on Raspberry Pi with Docker".
In this article, Pete Shima explains in details how to install a TIG (more on this later) solution on a Rapberry Pi with Docker.
TIG, meaning Telegraf, InfluxDb and Grafana, is a very nice solution that allows monitoring a network and showing the results on very nice dashboards.
Unlike Smokeping and MRTG, this solution does not reduce the granularity of the measurements even for long term monitoring. The disadvantage of this behavior is that the database size will grow indefinitely (and can possibly fill out the all disk).
On the other hand, this solution allows to browse all the measurements and to find what happened exactly in the past, without losing a single ping!
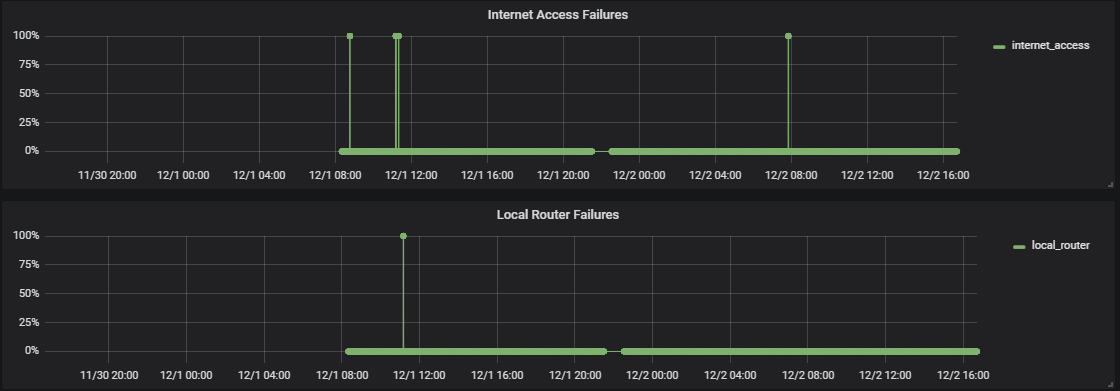
Below is a picture of two internet access failures that I could trace with this solution:

The graphic on the top, called "Internet Access Failures" shows the percent_packet_loss when telegraf pings three well known internet hosts (GAFA). If all pings are lost, it means that my internet access is down (100% packets lost). On this graphic, we see that we have two failures, one at 11:10 and one at 11:19 (nearly)
The graphic below, called "Local Router Failures" shows the percent_packet_loss when telegraf pings my local router (192.168.0.254). If all pings are lost, it means that my local router is not responding (in that case it was rebooting). On this graphic, we see that we only have one failure at 11:10
These two graphics allow me to differentiate between two different types of failures:
- The first one (at 11:10) means that my router is having a problem (but not my Internet Service Provider (ISP))
- The second one (at 11:19) means that my router is fine, but that my ISP is having a problem.
The schema below represents my home network connected to the internet by my ISP

In that case everything is fine, and the graphics should show 0% packets lost (no failures) for both Internet Access and the Local Router.
Now let's explain what happens at 11:10 with another schema

In that case, the local router is down, and the graphics shows that both the Internet Access and the Local Router are unreachable (100% packets lost)
And finally, a third schema to explain what happens at 11:19

This time, it is the ISP that has a problem, and the graphics show that le Internet Access is unreachable (100% packets lost) while the Local Router is reachable (0% packets lost)
The problem
Out of the box, a TIG solution will easily provide graphics similar to the graphics shown above. Below is an example of what we can get from an out-of-the-box TIG solution.

As you can see, the failures on 11:10 and on 11:19 are clearly represented. Notice that the graphic above shows actually three lines (on for each internet host) on top of each others.
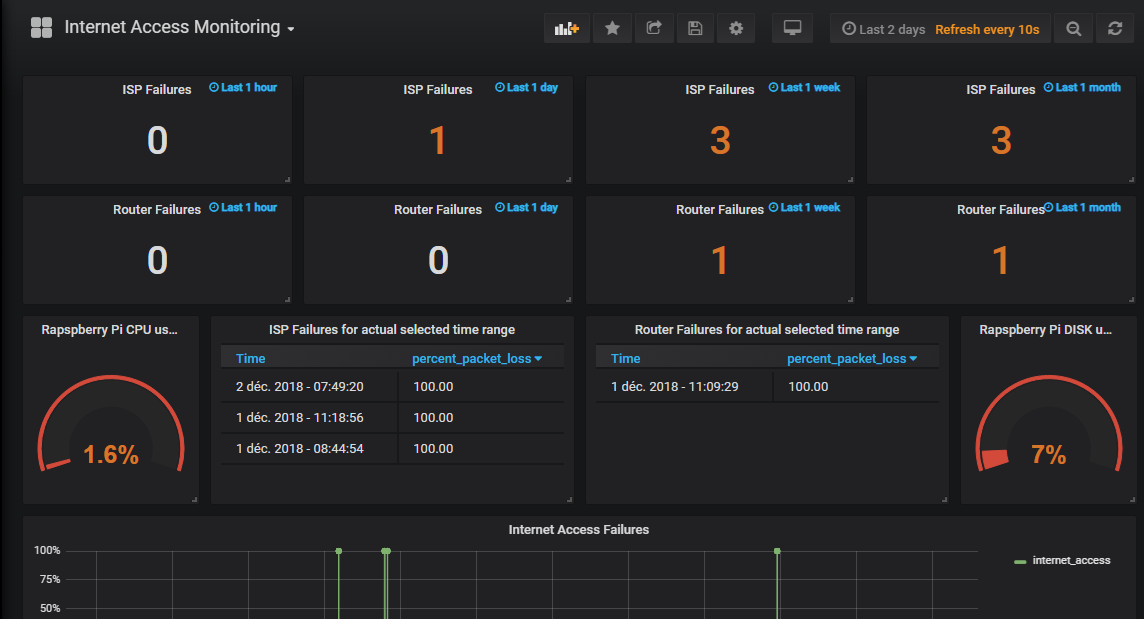
But what happens if we take a look on the same graphics with a different time range, let say 2 days.
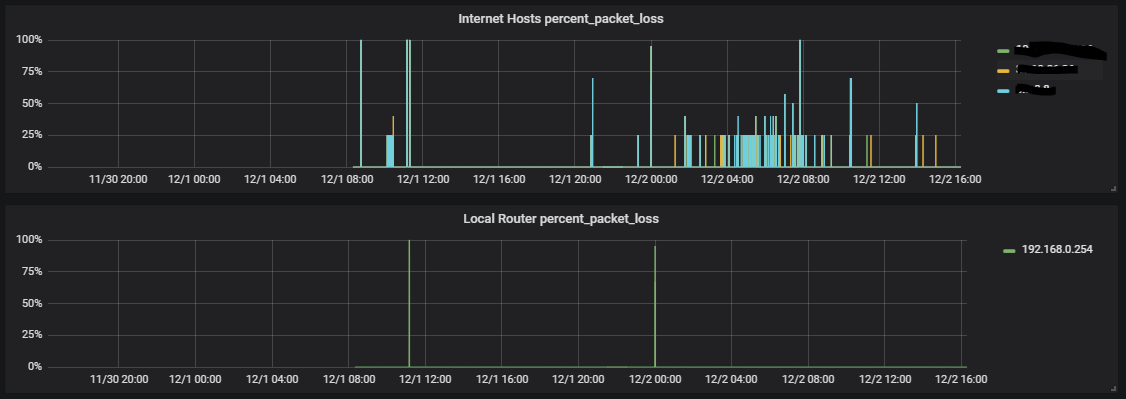
As you can see, it is now very difficult to find out how many internet access failures happened in this time range (actually four).
The problem is that it is very difficult to find out the times when all internet hosts were down at the same time. A ping can get lost. An internet host can be unreachable for a while, and in that case, the graphic gets "polluted" with unwanted spikes.
The goal to achieve
In order to have a much better view of the real internet access failure, we could write our own telegraf plugin to get reed of all that noise and to output a clean graphic in Grafana. Furthermore, we could add same features that would be nice for the end user like a counter of failures, or a table that shows all the failures and the exact time when they occurred.
Clean graphic
This graphic shows 4 Internet Access failures, and 1 Local Router failure. It gives as an overall view or the failures, but it's still difficult to read when failures are very close from each other.
Table of failures

These tables summarize the two type of failures and give the exact time of occurrence. It helps to differentiate the failures that are very close on the above graphic.
Failure counters

These counters show the number of detected failures and differentiates the ISP failures from the Local Router failures. They give a good summary of what happened on the network at different time range.
The solution
In order to achieve our goal with a TIG solution, we will need to use the output of telegraf to generate a new "measurement" in the influx database that will provide us with the information we need to create the corresponding dashboard in Grafana.
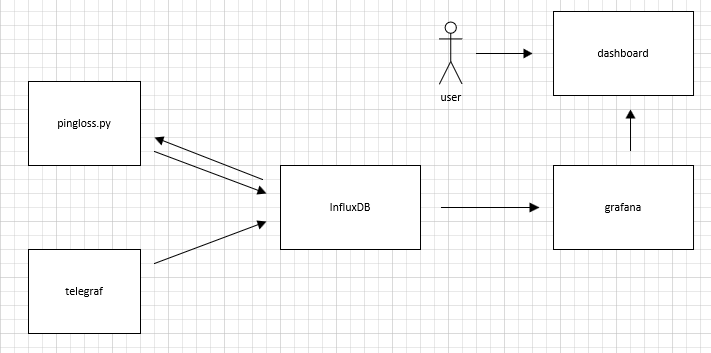
Having no experience in Go programming, I gave up thinking of writing a telegraf plugin. Instead, I wrote a python service (pingloss.py) that runs on the Raspberry Pi as a service. This service will loop forever and update regularly (every 10s) a new measurement in influxdb database with values computed from the telegraf updates.
The schema below gives an overview understanding of that behavior (the network is not represented)
Now let's get a little bit more practical
Installation of the TIG solution
The installation is well described by Pete Shima, so if you want to give a try, just follow this link.
I did some little modifications, using docker persistent storage for InfluxDb and for Grafana. I also configured the containers to start at boot time.
Below is a short resume of my installation.
Get all images
This will take a while, so get ready for a coffee…
| docker pull influxdb docker pull proxx/grafana-armv7 docker pull arm32v7/telegraf docker pull gremaudpi/pingloss |
Influxdb
# create a persistent volume for influxdb
| docker volume create influxdb-storage |
Create indfluxdb container
| sudo docker run --restart unless-stopped --detach \ --net=host --name=influxdb --volume=influxdb-storage:/data influxdb |
# test
| docker logs influxdb |
Telegraf
Pete Shima explains how to generate a default telegraf.conf file. You will find this file on this link (remove the .txt extension)
| sudo nano /home/pi/telegraf.conf |
You will have to modify the line 9 (urls to ping) accordingly to your needs in order to have a functional solution. Pay attention to the fact that this is only a part of the file, the rest of the fine does not need to be modified.
###############################################################################
#                            INPUT PLUGINS                                    #
###############################################################################
[[inputs.ping]]
## NOTE: this plugin forks the ping command. You may need to set capabilities
## via setcap cap_net_raw+p /bin/ping
## urls to ping
## please replace the ip address below with well known internet hosts
urls = ["10.10.10.10","10.10.10.11","10.10.10.12"]
## number of pings to send per collection (ping -c <COUNT>)
count = 3
## interval, in s, at which to ping. 0 == default (ping -i <PING_INTERVAL>)
ping_interval = 0.5
## per-ping timeout, in s. 0 == no timeout (ping -W <TIMEOUT>)
timeout = 2.0
## interface to send ping from (ping -I <INTERFACE>)
interface = "eth0"
## override the default name to router
name_override = "internet_hosts"
###############################################################################
#                            ROUTER PLUGINS                                   #
###############################################################################
[[inputs.ping]]
## NOTE: this plugin forks the ping command. You may need to set capabilities
## via setcap cap_net_raw+p /bin/ping
## urls to ping
##  please replace the ip address below with your local router ip address
urls = ["192.168.1.1"]
## number of pings to send per collection (ping -c <COUNT>)
count = 3
## interval, in s, at which to ping. 0 == default (ping -i <PING_INTERVAL>)
ping_interval = 0.5
## per-ping timeout, in s. 0 == no timeout (ping -W <TIMEOUT>)
timeout = 2.0
## interface to send ping from (ping -I <INTERFACE>)
interface = "eth0"
## override the default name to router
name_override = "local_router"
…
Warning : I would recommend to put real ip addresses and not domain names to avoid the problem of DNS resolution errors during internet outages.
Execute following command to allow telegraf to fork ping
| sudo setcap cap_net_raw+p /bin/ping |
# Create telegraf container
| sudo docker run --restart unless-stopped --detach --net=host --name=telegraf \ --volume=$PWD/telegraf.conf:/etc/telegraf/telegraf.conf:ro arm32v7/telegraf |
# test
| sudo docker logs telegraf |
Grafana
Follow this link for more information on Grafana installation.
http://docs.grafana.org/installation/docker/
# Create a persistent volume for Grafana
| sudo docker volume create grafana-storage |
# Create grafana container
| sudo docker run --restart unless-stopped --detach --net=host \ --name=grafana --volume=grafana-storage:/var/lib/grafana proxx/grafana-armv7 |
# test
| sudo docker logs grafana |
Pingloss
I made this particular image myself in order to populate a special measurement in InfluxDb with the status of the local router and of the internet hosts that Telegraf monitors. It is mainly a Python script that loops for ever and writes points to InfluxDb every 10 seconds.
# Create pingloss container
| sudo docker run --restart unless-stopped --detach --net=host \ --name=pingloss gremaudpi/pingloss |
Verifiying everything is OK
| sudo docker ps |
Output:

reboot and check if the containers are still running
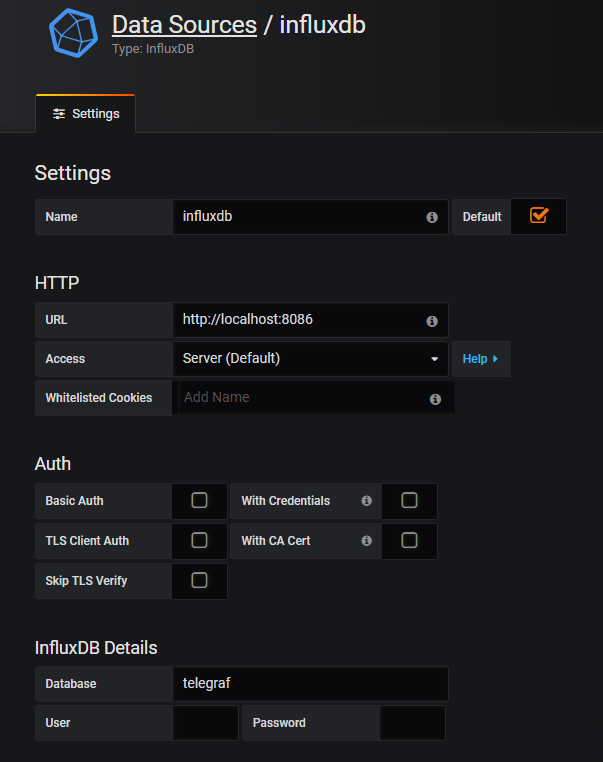
Setup Grafana
Open a web browser and navigate to grafana's home page using following URL:
Login with admin/admin (if this is the first time)
Import the dashboard that you will find on this link
And Wouala !! You are done !
I love your work, you helped me so much. If you need to update configuration of telegram later just do:
nano /home/pi/telegraf.conf
do necessary changes
and finally
sudo docker restart telegraf
Thank you Michal, happy to hear that you found it helpfull...
I'm starting with Raspberry and python, thank you very much for this post.
Hey, this guide was great, thanks so much for putting together.
I have it all installed, and it pulls stats and charts them fine, but the top stats for ISP failures and Router failuers show somewhat random numbers for me. Everytime it refreshers it's a different number, so is not reporting correctly.
I've had no disconnects since installing as the line graphs show, but these numbers are all over the place.
Would you have any idea why that might be?
I have 192.168.1.1 set which is my main router, it's connected to another router from my isp, that's in modem mode that's on 192.168.100.1, I tried that one as well but the same thing get sreported.
It's odd, and I can't work out why it might be.
I may have actually just worked it out accidentally after commenting, when I went to edit the box, it says queries to default.
If I set this as influxdb and then in select measurement change this to internet_hosts or ping_loss, I think I get the info I'm supposed to!
If this is wrong, then please let me know if you can 🙂
Could you link to the github repo for your pingloss.py? I am working on an intel infrastructure and need to build the image for an intel architecture. Very excited to get this running!
Try this link https://gremaudpi.emf-informatique.ch/wp-content/uploads/2018/12/pingloss.txt
Like!! Thank you for publishing this awesome article.
Like Simon I have the problem that most of the panels in Grafana are defaulting to "default" under queries to. Once I change that to influxdb some of them start working. Others still have their settings messed up. I have managed to recreate some of them, but I a struggling with others. All the top ones counting the outages and "Internet lost packets for actual selected time range" I have not been able to recreate. Would you mind sharing your settings for each panel? That would be amazing.
Thanks for this tool by the way, it was exactly what I was looking for and so far it seems great. I hope I can get these problems solved.